Free US & World Debt Data (CSV + Charts)
These files are free to use. Credit the source: Source: EveryDebtClock.com.
Each file is taken from figures this site already publishes, with the source and as-of date on every row. Dollar amounts are the official stocks, not the live clock. A blank cell means that source has not published the figure. OMB surplus is the Historical Tables balance: positive is a surplus, negative is a deficit. The country file is the same stock as the world debt clock: general government debt, from IMF, Eurostat, QPSD, or a national series. A country's own clock can be a narrower total. The United States row there is the IMF figure. Federal debt from Debt to the Penny is in the US files.
CSV files
| File | Series | What it contains | Rows |
|---|---|---|---|
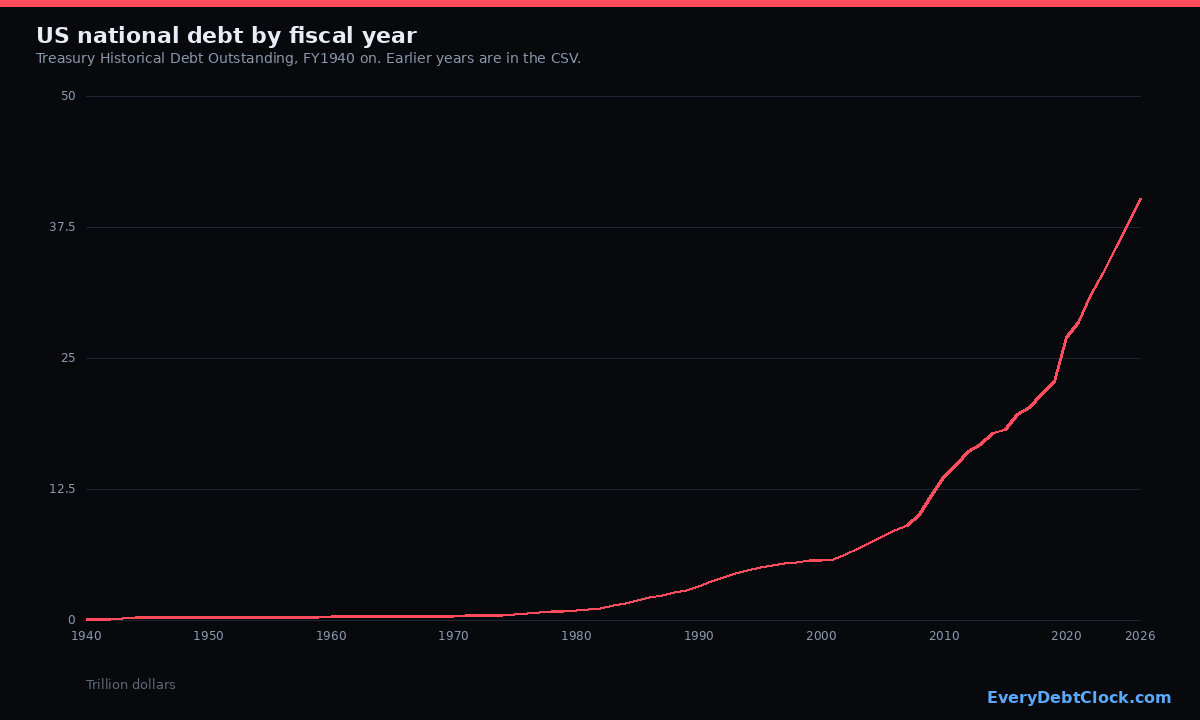
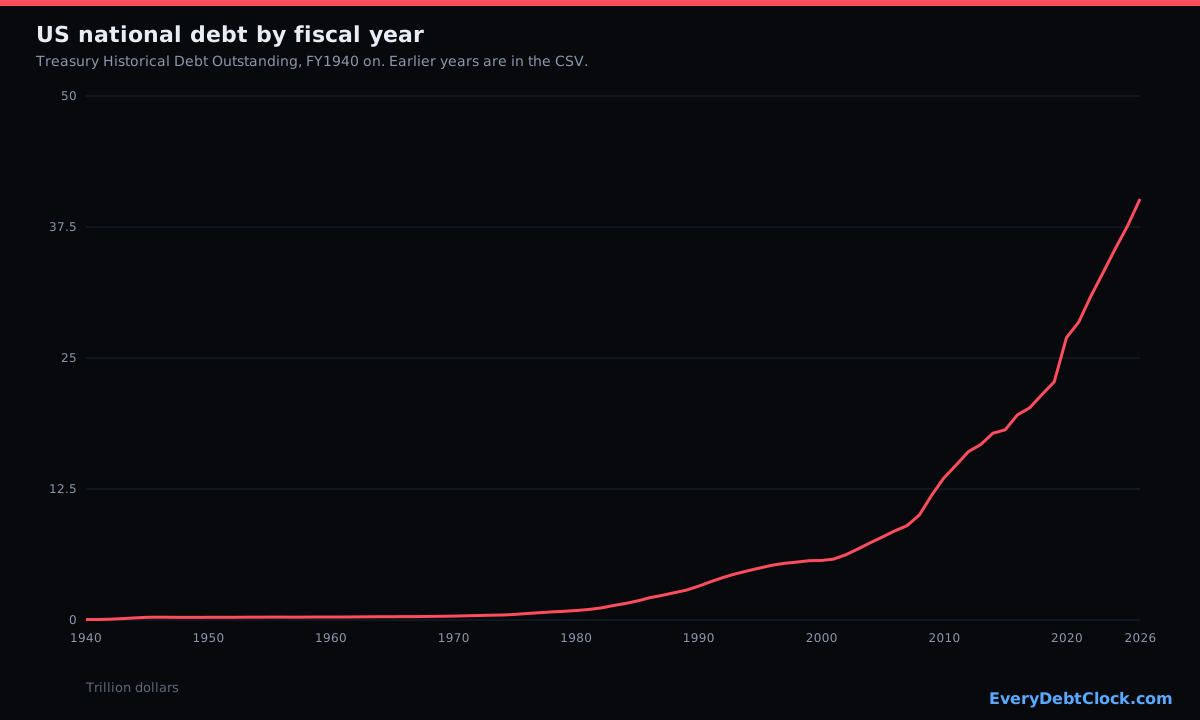
| us-debt-by-year.csv | US national debt by fiscal year | Treasury total at each fiscal year end, plus OMB debt-to-GDP and the surplus or deficit where the FY2027 Historical Tables publish them. | 237 |
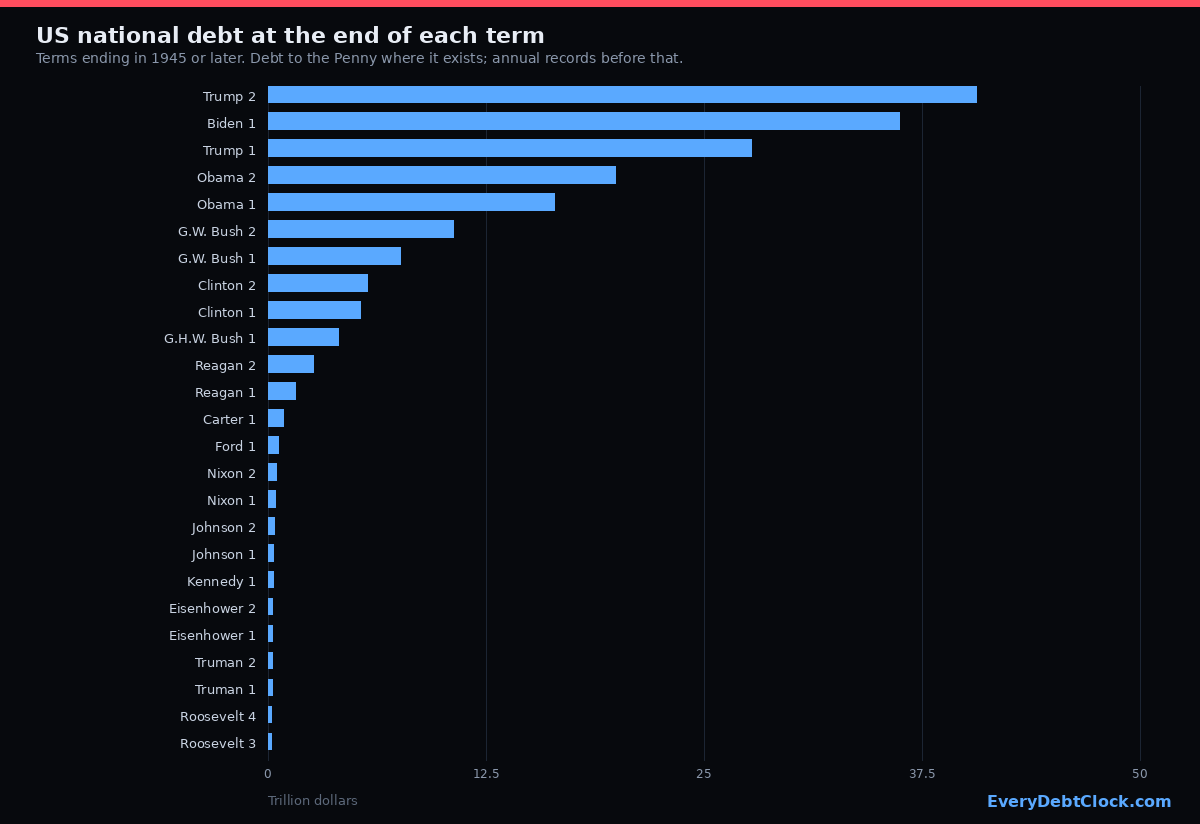
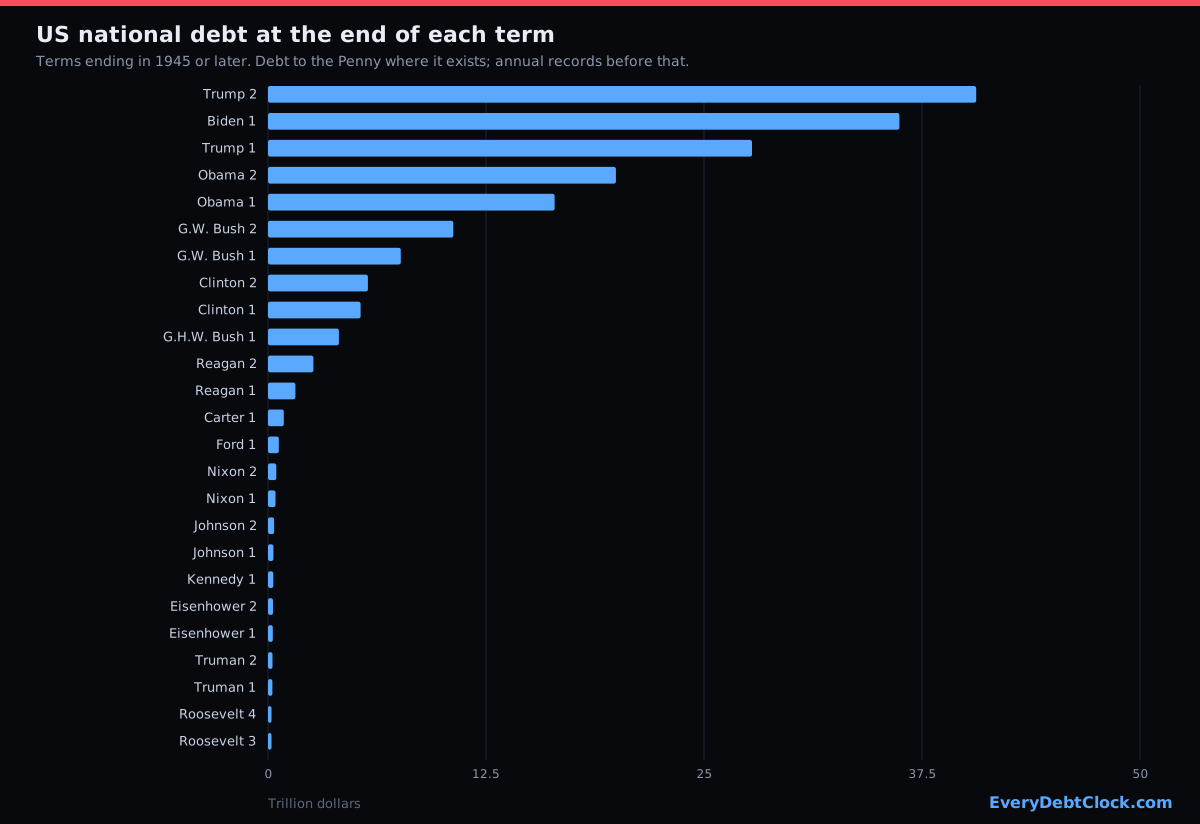
| us-debt-by-president.csv | US national debt by president | Debt at the start and end of each term. Daily closes from 1993; annual Historical Debt Outstanding before that. The open term ends at the latest Debt to the Penny close. | 69 |
| us-debt-per-person.csv | US debt per person, household, and tax return | One row for the latest Treasury close divided by Census population, Census households, and IRS returns filed, then one row per fiscal year of debt divided by the July 1 population. | 128 |
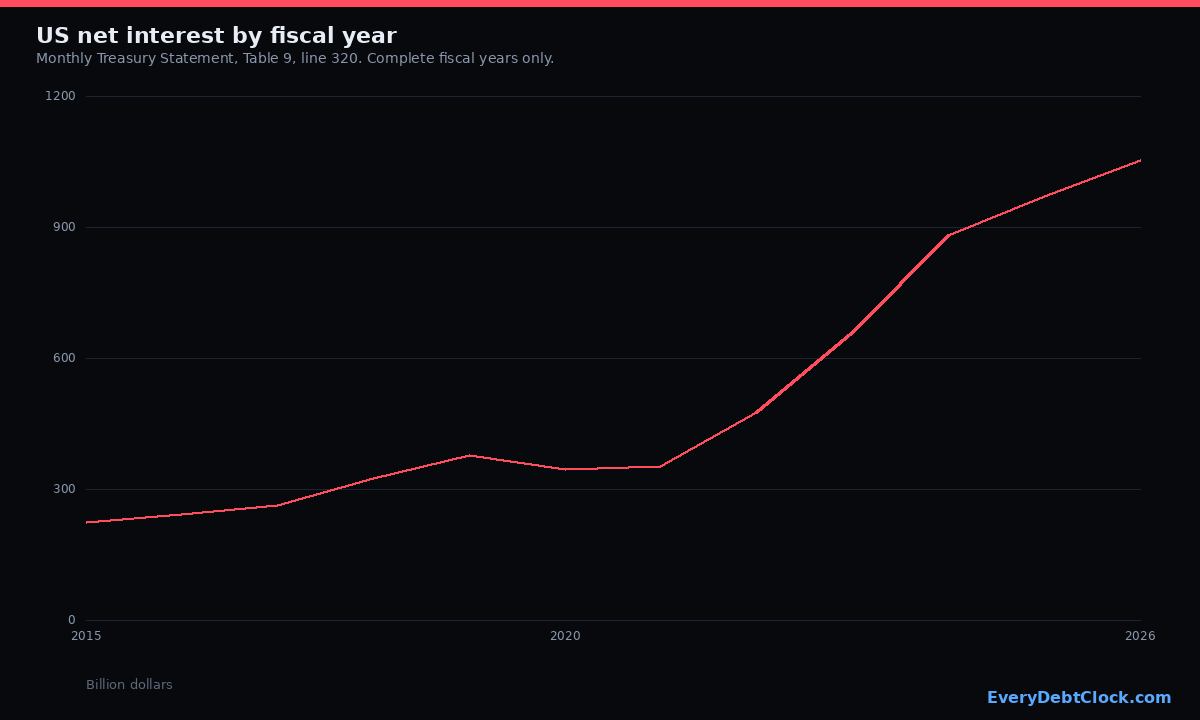
| us-interest.csv | Interest on the US debt | Official Daily Treasury Statement cash interest, MTS net interest by fiscal year, and Treasury's interest-expense dataset by fiscal year. | 32 |
| us-state-debt.csv | US state debt | Census state and local government debt for all 50 states and the District of Columbia. The total is the official stock on each state page, not the projection. | 51 |
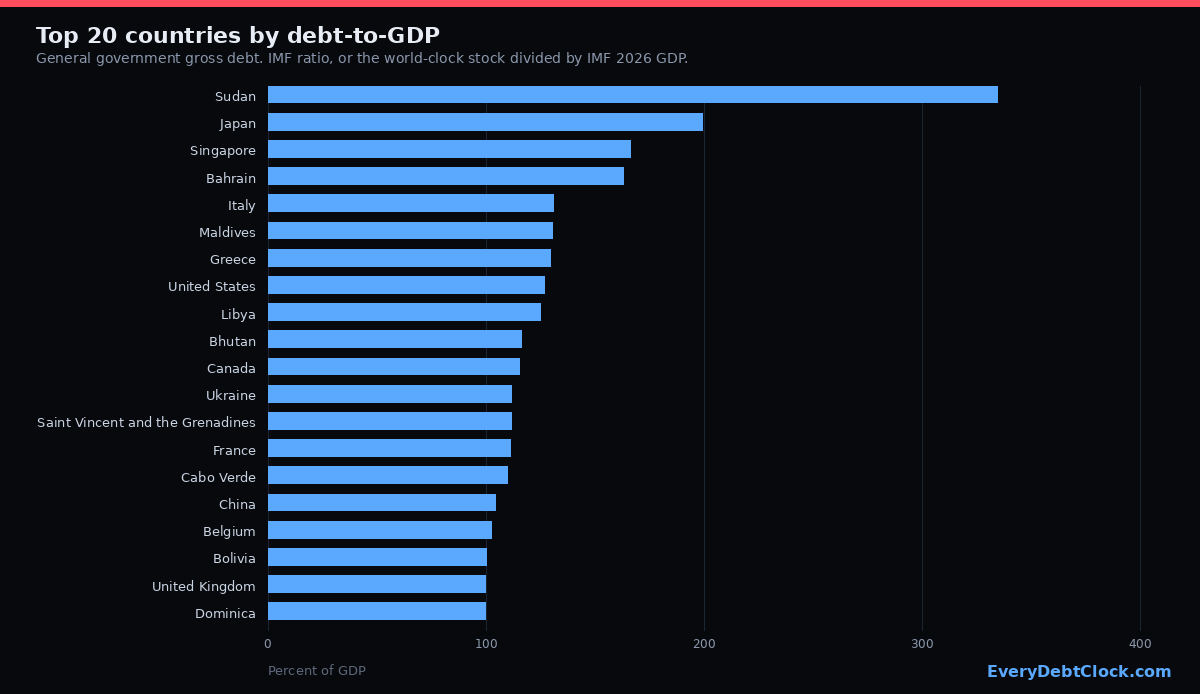
| country-debt.csv | Country debt | One row per economy on the world debt clock, with the source (IMF, Eurostat, QPSD, or a national series) and the as-of date. | 186 |
Charts
Redrawn on every build from the CSV files. Each image carries the credit EveryDebtClock.com.
US national debt by fiscal year
Citation
Source: EveryDebtClock.com (https://everydebtclock.com/)
HTML
<img src="https://everydebtclock.com/data/charts/us-debt-by-year.png" alt="Line chart of US national debt by fiscal year from FY1940">
<a href="https://everydebtclock.com/">Source: EveryDebtClock.com</a>
US national debt by president
Citation
Source: EveryDebtClock.com (https://everydebtclock.com/)
HTML
<img src="https://everydebtclock.com/data/charts/us-debt-by-president.png" alt="Bar chart of US national debt at the end of each presidential term since 1945">
<a href="https://everydebtclock.com/">Source: EveryDebtClock.com</a>
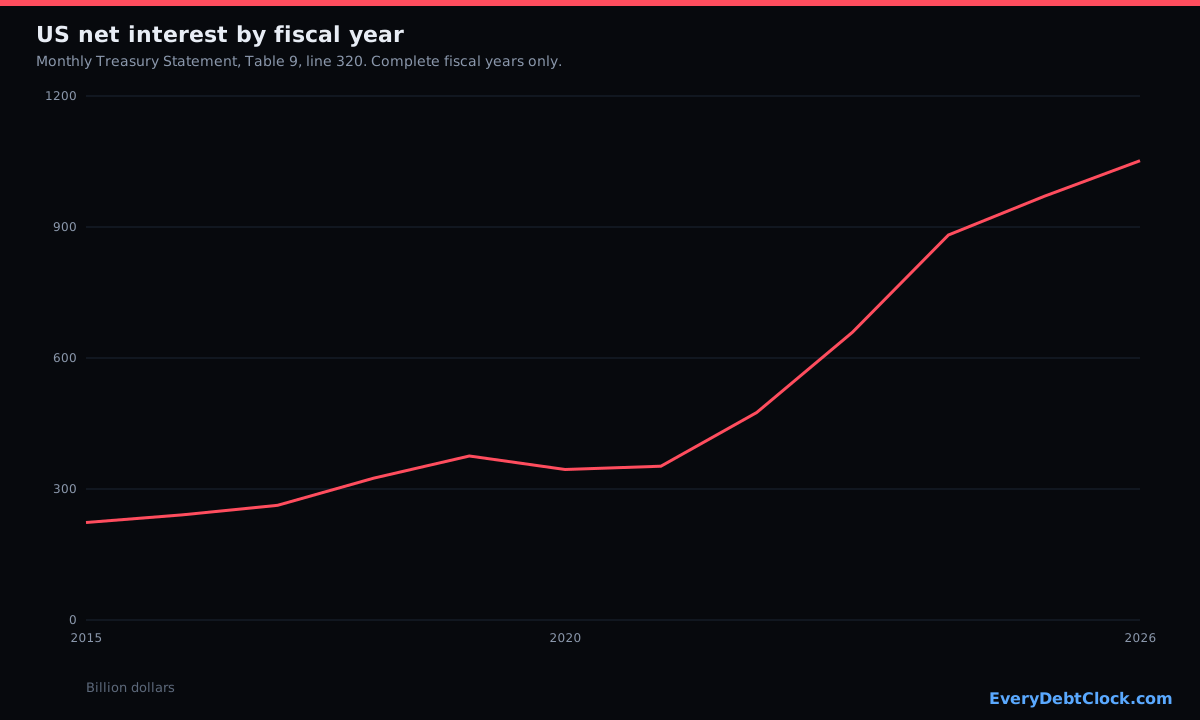
US net interest by fiscal year
Citation
Source: EveryDebtClock.com (https://everydebtclock.com/)
HTML
<img src="https://everydebtclock.com/data/charts/us-interest-by-year.png" alt="Line chart of US net interest on the debt by fiscal year">
<a href="https://everydebtclock.com/">Source: EveryDebtClock.com</a>
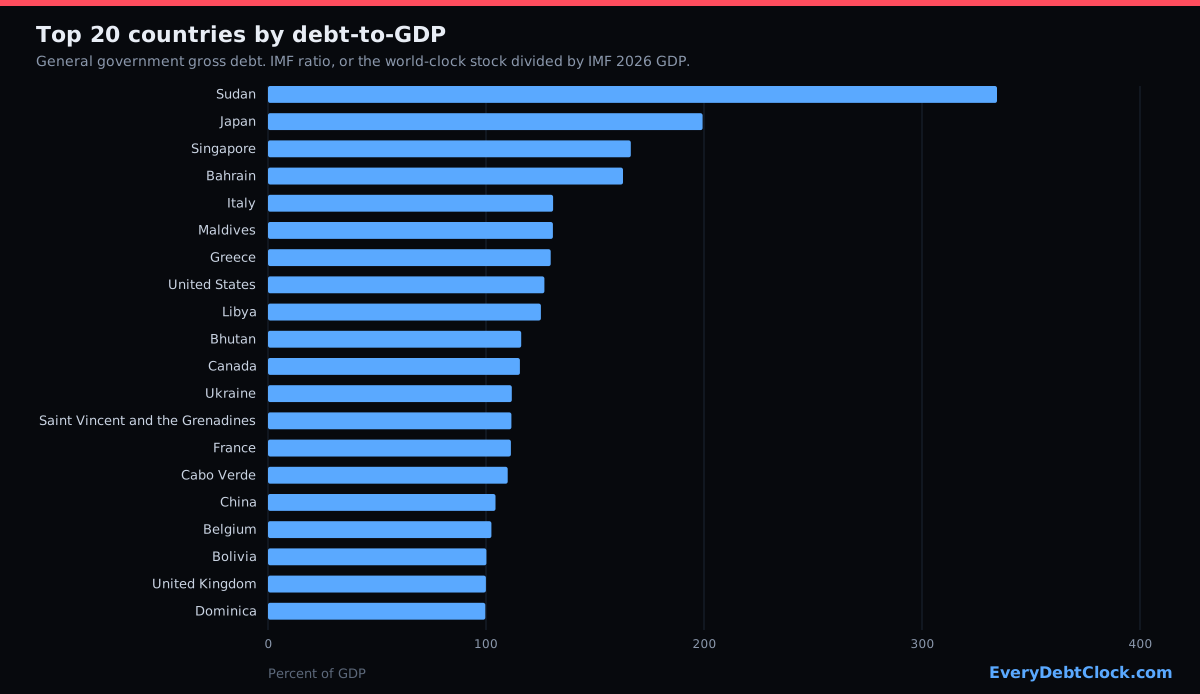
Top 20 countries by debt-to-GDP
Citation
Source: EveryDebtClock.com (https://everydebtclock.com/)
HTML
<img src="https://everydebtclock.com/data/charts/countries-debt-to-gdp.png" alt="Bar chart of the 20 countries with the highest general-government debt-to-GDP">
<a href="https://everydebtclock.com/">Source: EveryDebtClock.com</a>
The same figures, with the source notes, are on national debt by year, debt by president, debt per person, interest on the debt, state debt clocks, and the world debt clock.